Projects
Using Microsimulation for Supplemental Nutrition Assistance Program (SNAP) Policy Analysis
2016–Present

Mathematica updates and maintains FNS’s SNAP microsimulation models, uses the models to conduct policy simulations, prepares the edited SNAP Quality Control (QC) data file, and publishes annual reports on the characteristics of the current SNAP caseload and on national and State SNAP participation rates.
FNS requires detailed information on the current SNAP caseload and the estimated SNAP-eligible population as well as estimates of SNAP eligibility and participation under proposed changes to SNAP policies. Timely access to these data allows FNS to make evidence-based decisions on how to administer the program and synthesize information on the estimated impact of proposed changes for policymakers and stakeholders.
U.S. Department of Agriculture, Food and Nutrition Service
The Supplemental Nutrition Assistance Program (SNAP), administered by the U.S. Department of Agriculture (USDA) Food and Nutrition Service (FNS) in partnership with State governments, provides nutrition assistance to eligible, low-income individuals and households in need.
SNAP is the cornerstone of the nutrition safety net. Mathematica has been working alongside the U.S. Department of Agriculture’s Food and Nutrition Service (FNS) for more than four decades to develop and use microsimulation modeling to support FNS as it assesses proposed changes to SNAP policy, develops annual budgets, and conducts supporting research. Important questions arise when changes to SNAP policy are proposed, including how the proposed change is estimated to affect program costs, SNAP participation and eligibility, and the characteristics of the SNAP caseload. In response, Mathematica uses microsimulation modeling to produce simulations and tabulations that enable FNS and other policymakers to better understand the populations potentially affected by such changes.
Under this project, Mathematica maintains and enhances FNS’s SNAP microsimulation models, provides quick response analyses and technical support, prepares the annual SNAP Quality Control (SNAP QC) data file, and produces annual reports on the characteristics of SNAP households and national and state SNAP participation rates.In addition to these core tasks, Mathematica provides a variety of services as requested by FNS. These have included the following:
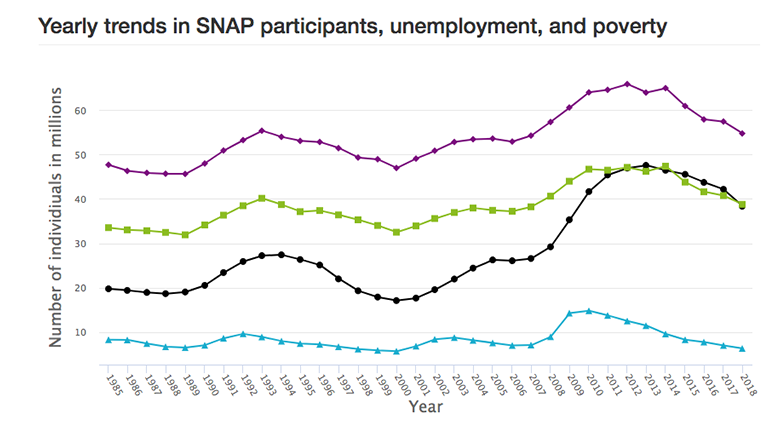
Over time, changes in the number of SNAP participants usually correspond with changes in the number of individuals with income below the federal poverty level. That is, the SNAP caseload typically increases when the number of individuals in poverty increases, and decreases when the number of individuals in poverty decreases.
Explore Trends
This report describes the characteristics of SNAP households and participants nationwide in fiscal year 2018 (October 2017 through September 2018). It also presents an overview of SNAP eligibility requirements and benefit levels in fiscal year 2018.
Learn MorePartner with us at the intersection of data science, social science, and technology to progress from inquiry to insight to impact. Our evidence-informed solutions empower you to see clearly and act quickly.
Our experts can help you make smart, sustainable decisions. From local to global challenges in health, human services, and international development, we’re here to improve public well-being and make progress together.
Work With Us