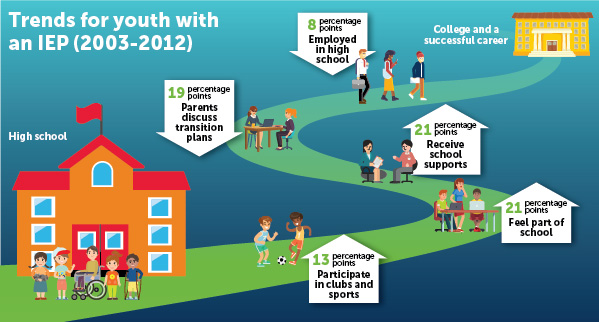
A large-scale study by Mathematica Policy Research finds that over the past decade (2003–2012), high school youth participating in special education became more engaged in school and increased their use of school supports. Both are outcomes encouraged by the most recent federal legislation supporting students with disabilities, known as the Individuals with Disabilities Education Act (IDEA 2004). At the same time, these youth, required under IDEA to have an individualized education program (IEP), are less likely than in the past to take some key steps to prepare for their transition to adult life. Among students with an IEP, youth with emotional disturbance or an intellectual disability experienced more positive changes over the past decade than youth in other disability groups.
The report, “Preparing for Life after High School: The Characteristics and Experiences of Youth in Special Education, Volume 3: Comparisons Over Time,” and an accompanying fact sheet, released today by the Institute of Education Sciences, presents new information on trends in the characteristics and experiences of youth in special education across the country. It is the third report from the National Longitudinal Transition Study 2012 (NLTS 2012). Mathematica is conducting NLTS 2012 for the National Center for Education Evaluation and Regional Assistance as part of the congressionally mandated national assessment of IDEA 2004, and it is the third study in the NLTS series commissioned by the U.S. Department of Education over the past several decades. This report volume compares survey data in 1987, 2003, and 2012 (from NLTS, NLTS 2, and NLTS 2012) focusing on trends for 15- to 18-year-olds with an IEP overall and in each of 12 federal disability groups.
“Parents, educators, and policymakers alike are concerned with creating pathways to adulthood and independent living for children with disabilities. This study compares how supports have changed over the past decade to help gauge progress in addressing the needs of youth with disabilities,” noted study director Joshua Haimson.
Key findings from the report include the following:
- In the past decade, youth with an IEP have become more engaged in school and extracurricular activities, but there was little change in grade retention, suspensions, and expulsions. The proportion of youth with an IEP who felt a part of their school grew from 2003 to 2012 by more than 20 percentage points (from 31 to 52 percent), and their reported participation in school clubs or sports teams also increased by 14 percentage points (from 48 to 62 percent). Nevertheless, similar proportions in both years were reported to have ever repeated a grade (35 and 37 percent), been suspended (34 and 32 percent), or been expelled from school (7 and 9 percent).
- Youth with an IEP are more likely than in the past to receive supports at school but less likely to get them at home. According to parents, receipt of any school-based special education services grew by 21 percentage points from 2003 to 2012 (44 versus 65 percent), with the largest growth in services from a tutor, reader, or interpreter (from 18 to 33 percent) and psychological counseling (from 13 to 28 percent). However, the proportion of parents who said they helped their children with homework at least weekly declined by 7 percentage points (from 62 percent to 55 percent).
- Participation in some key transition activities declined, though not in IEP meetings. In both 2003 and 2012, most older youth and their parents reported having gone to an IEP meeting in the past two years (74 percent and 81 percent for youth; 89 percent and 91 percent for parents, respectively). But the proportion who reported ever meeting with school staff to discuss post-high school transition plans decreased (from 79 to 70 percent of youth; from 79 percent to 60 percent of parents). In addition, fewer students were working for pay while in high school in 2012 than in 2003 (20 percent versus 27 percent).
- Youth with an IEP are more likely than a decade ago to live in households that face economic challenges. For example, compared to those in 2003, parents of youth with an IEP in 2012 were twice as likely to report that their household received federal food benefits in the previous two years (16 versus 33 percent). The proportion of youth with an IEP who received Supplemental Security Income (SSI) benefits during that same period because they live in a low-income household and have a disability also increased from 16 to 21 percent, according to parents.
- Youth with emotional disturbance and intellectual disability made progress in more ways than did those in other disability groups. Research suggests a variety of experiences are associated with success after high school, such as engaging in school activities, behaving appropriately in school, receiving supports, functioning independently, and taking concrete steps towards college or work. Youth in these two groups showed more positive changes from 2003 to 2012 in these key experiences than youth in other disability groups. For youth with emotional disturbance, their reported participation in school sports and clubs increased (from 40 to 56 percent) as did their receipt of services from a tutor, reader, or interpreter (from 15 to 29 percent). Youth with emotional disturbance were also the only disability group to show improvements over the decade in how well students performed typical teenage tasks, such as fixing meals and getting to places outside the home without help (from 5 to 12 percent). For youth with intellectual disability, not only did their extracurricular participation and use of a tutor, reader, or interpreter grow (from 36 to 56 percent and from 14 to 36 percent, respectively), but their suspension rates also fell (from 38 to 25 percent).
Through surveys of parents and youth in 2012 and 2013, the NLTS 2012 collected data on a nationally representative set of nearly 13,000 students—mostly those with an IEP and expected to receive special education services. The study also included students without an IEP, who either have no identified disability or who have an impairment that does not qualify them for special education but allows them to receive accommodations through a 504 plan under the Rehabilitation Act, another federal law pertaining to the rights and needs of students with disabilities.
Read more about Mathematica’s portfolio of research in special education.


